NGiNX provides various metrics thru their status page (requires the stub status module). Setting up monitoring for NGiNX with Nixstats is easy, you can read more at our helpdesk.
Important NGiNX Metrics
The most important metrics to watch and alert to for NGiNX are writing, active and requests_per_second.
Besides this we recommend setting up alert through logging. You might want to setup a daily alert which will alert
you of any new entries in the error logs of nginx.
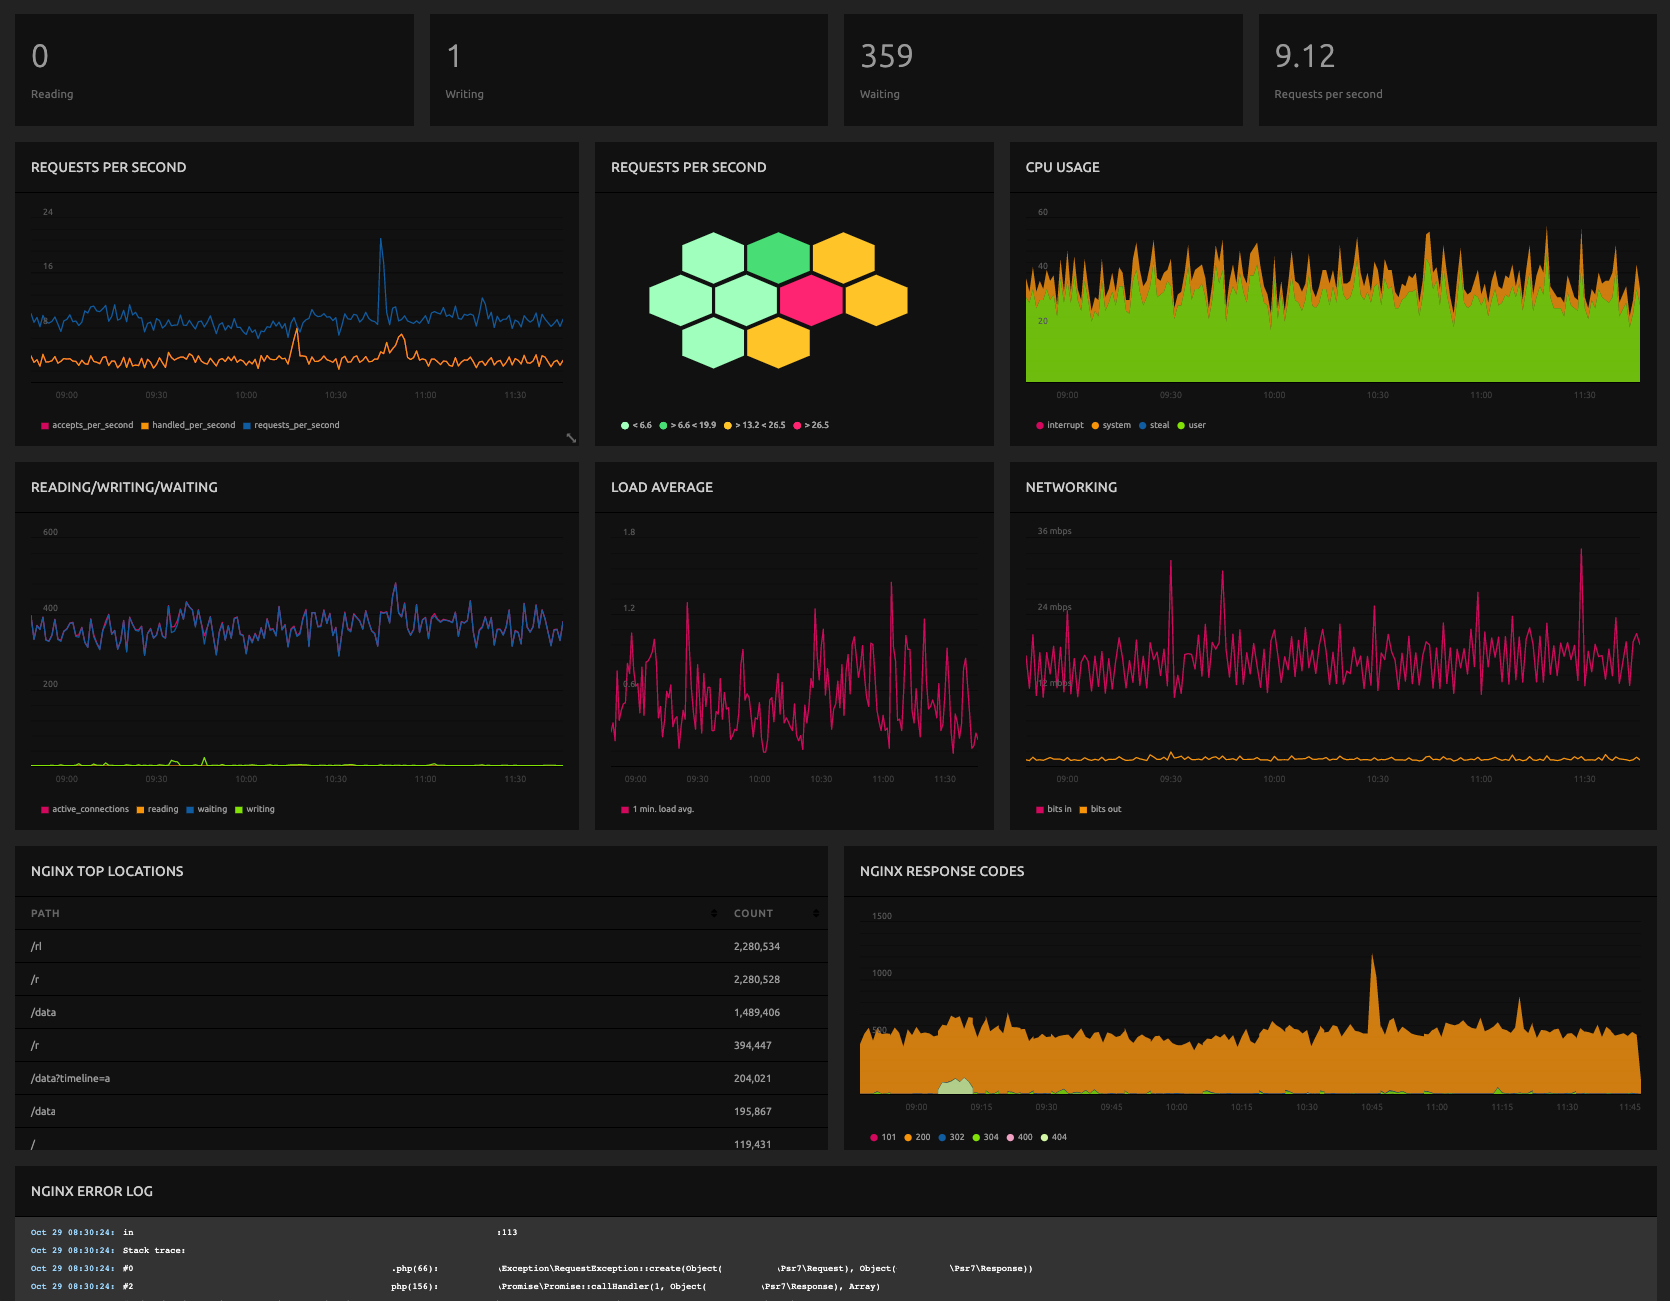
NGiNX Metrics
The following metrics are available from the NGiNX monitoring plugin. Source code is available on GitHub.
- Accepts per second
The amount of accepted client connections per second.
- Handled per second
The amount of handled client connections per second.
- Requests per second
Amount of requests per second processed.
- Accepts
Total amount of accepted client connections.
- Handled
Total amount of handled client connections.
- Requests
Total amount of requests processed.
- Reading
Current number of connections where nginx is reading the request header.
- Writing
Current number of connections where nginx is returning the response back to the client.
- Waiting
Current number of idle client connections.
- Active
Current number of active client connections.
- Top request locations
The top requested paths. Requires logging to be setup.
- HTTP status codes
HTTP status codes parsed from your access logs. Requires logging to be setup.
- Errors
NGiNX error logs entries. Requires logging to be setup.